


Fibonacci was a famous mathematician from the 1100’s who found a ratio that is reappears throughout nature, and it has been deemed “the golden ratio.” Considering it’s found in nature, someone decided it would make sense to try to apply this golden ratio to the stock market. They came up with an indicator known as “Fibonacci retracement lines.” Originally the lines were placed at points that were 38.2% and 61.8% above where the bottom of the chart began. The theory is they serve as support and resistance levels in between highs and lows on a stock chart. And it was theorized that stocks, being a part of nature, will follow the golden ratio and bounce off these levels. As time went on, more retracement levels have been added, as most stock software now has the 23.6% level and the 50% level added. I have an example in the picture below.
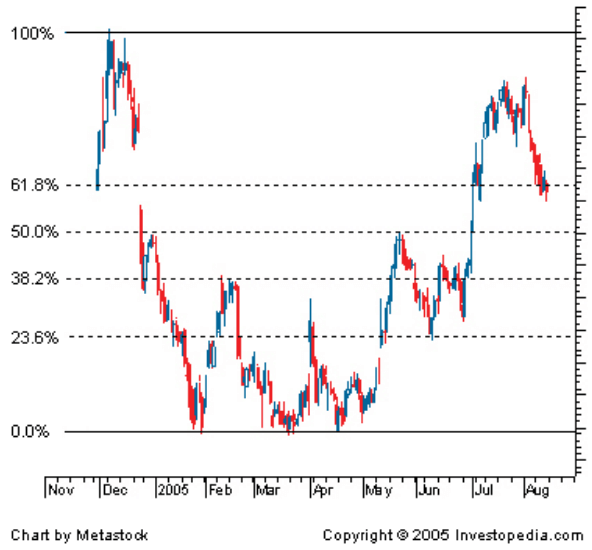
So in this example you have a total of four points that the stock could supposedly bounce off as it sinks from its highs, thus fulfilling the golden ratio and fans of Fibonacci around the world! Oh wait…
**Spoiler Alert** Fibonacci Retracement is Horse Poop
If I have a chart with a high point and a low point, and then I draw four lines somewhere in-between that high point and low point, the laws of probability tell me the stock will eventually bounce off one of those lines. You could draw them anywhere! So when the stock does bounce off of one of these Fibonacci lines, people say “see look, it works” and confirmation bias takes over. But when the Fibonacci points don’t work out, and let’s say the stock crashes right through them, people will make excuses. You may hear things like “you weren’t use the right top and bottom” or “sometimes it doesn’t work.” But the truth is it’s all just confirmation bias and hindsight bias!
This leads me to my next point, which is where are you supposed to draw these lines? A big problem with Fibonacci retracement lines, similar to Elliot Wave Theory, is there is no set place that marks the proper top and bottom of a stock chart. So, as I’ll show in the example below, any of the places I’ve put the top and bottom could be accurate.
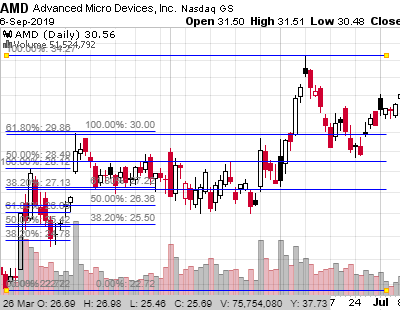
And this is just the daily chart. I could be doing this on the 5 minute chart, hourly chart, weekly chart, etc. And then how far should I be going back in time to look for tops and bottoms? 1 week? 2 weeks? A year?
You see, what people do is they set up these Fibonacci retracement lines to “fit” past chart patterns. Then they say “look see, it works great!” But when they try using it to actually make money in the stock market, predicting future price action, it has the same success rate as Bernie Sanders picking up women at a bar… as in less than chance.
I remember as a young stock trader trying to use Fibonacci retracement points to make money off stocks. I had just bought a book off Amazon that showed me how I was supposed to use these magical lines. As I started to draw the lines on charts more and more, and learned more about the confirmation bias associated with technical analysis, I realized that these “Fibonacci Retracement” lines were just another crap indicator that could be added to ever-so-large, crap indicator pile.
And it’s the same thing with Fibonacci projection, the Fibonacci fan, Fibonacci time zones, etc. All these are just spin-offs of Fibonacci retracement, and someone, somewhere is laughing all the way to the bank, as people buy courses on these garbage technical indicators. Do yourself a favor and stay away from this hocus pocus. The only technical indicator that has some merit is RSI, but even that isn’t all it’s cracked up to be.
Let me know what you think of sir Fibonacci, or any other technical indicators you find useful in the comments below!